Actionable intelligence is what every Manager craves for, especially those who manage factories and production lines. Nobody wants inefficiencies in their production line. The problem is finding them and their causes. This is where Overall Equipment Effectiveness (OEE) could help Managers. OEE is not a new concept, a relatively simple metric that provides insight into how well your manufacturing process is working.
While OEE seems simple, it can be difficult in a practical sense to implement. For example, in calculating Availability for a CNC milling machine, the actual uptime could be affected by being starved for parts from an upstream process or unplanned maintenance due to broken tools or jamming. This often leads to debate in a plant as how to define critical parameters those are to be used in calculating OEE. Plants with older machines may find it harder to get Availability data. We may or may not be able to interface with older controllers or proprietary data formats. Using the right data is critical in implementing a good and effective OEE tracking system.
When you consider implementing an OEE tracking system, the core areas to focus will be data capture, calculation of the OEE using six big losses in real-time and plant friendly dashboard with operational, tactical and strategic view of various parameters. In this blog, we will discuss a practical approach for data collection, computation and visualization of metrics for a plant floor.
We recommend using TAED - Target (expected good parts), Actual (actual good parts), Efficiency (ratio of actual to target) and down time to motivate the shift operators to win their shift. Use the six big losses as an effective tactical metrics. Calculate and use OEE as a strategic metric to drive and track improvements over a period of time.
As we have seen the main factors influencing OEE are availability, performance and quality. There are many conditions that will impact these values, which are popularly known as six big losses. Major objective of OEE tracking is to reduce or eliminate the six big losses. Let’s examine them.
![]()
Parameters such as Ideal Cycle time, planned stops, and start up rejects can be given as ‘Configuration’ parameters to the system. Parameters such as Product counts, stop times, and Cycle speed are measured and calculated using the data available from the machine or by deploying appropriate sensors.

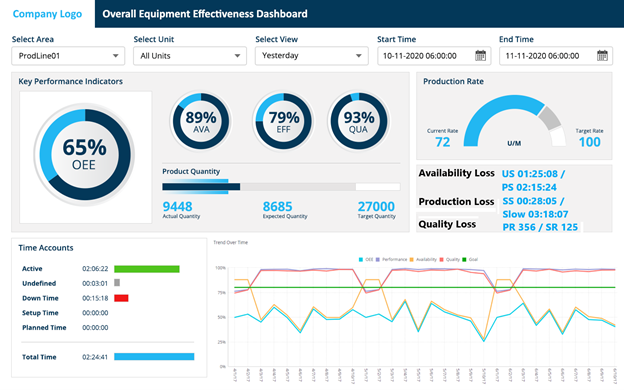
Figure 1 - OEE Dashboard with TAED, Tactical and Strategic metrics
Gadgeon Systems Inc - IoT software development company has implemented OEE tracking with customized dashboards for its customers. These dashboards are catered to three main user groups – Technicians, Production supervisors, and Strategic users (senior management). The TAED metrics enables the technicians and the production supervisors to ‘win the shift’. The tactical and strategic metrics will enable the senior management to track and improve over long term.

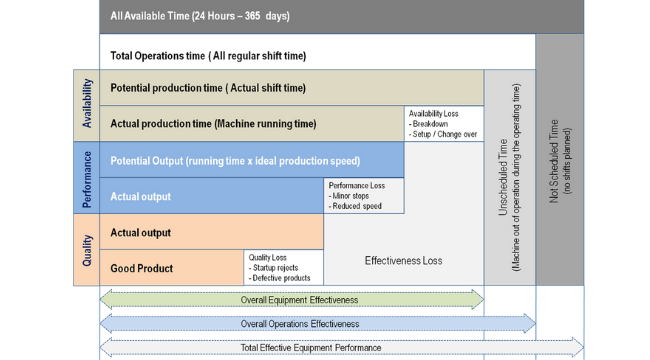
Figure 2: OEE, OOE, and TEEP
Image concepts are adopted from www.oeecoach.com
Availability losses - To improve availability look for and identify conditions that cause unavailability of equipments. Most common causes observed are:
The actual factors that contribute to equipment failure may vary across factories, however the impact is common - loss of productivity.
There are several strategies for minimizing equipment failure such as:
This information enables the team to reduce downtime by attending to the reasons one after the other starting with the most common causes of downtime.
Time taken for setup and adjustment of machines are considered under planned stops. When we want to use the machine to produce a different product, we have to retool or make adjustments. There will be time, when the machines are shut down to carry out preventive maintenance. These time intervals are beneficial as well unavoidable to production, it can be better timed to minimize impact on planned production time.
Some options for reducing the setup or adjustment times are:
Performance losses – are tricky to monitor because it’s not a case of a complete shutdown of the system. Rather, there is production but not at the optimum expected rate.
It is difficult to completely eliminate performance losses, however can be reduced by adopting following strategies:
Idling and minor stops are most of times appear to be insignificant, as they typically last for less than five minutes or so. However, if not quickly recognized, they could cause slow down the production. Consider the below listed practices that help in managing the idling and minor stops.
As you make progress in tracking problems and eliminating them, it is necessary to reflect these improvements in their standard procedures and train the staff accordingly. This will help prevention of the problem from reoccurring.
Reduced speed, or slow cycle, occurs when equipment runs slower than its Ideal Cycle Time. Reduced speed may be caused by wear and tear, aging, poor maintenance, electrical problems, or mishandling, etc.
The following actions can help address the issue of reduced speed:
Quality losses - Quality loss may occur as process defects or reduced yield.
Process defects can occur during any time during production. For ensuring a smooth operation, quick identification of causes of these defects and resolution is important.
Monitoring the machines directly will enable checking of process defects. Age of the equipments may be a major factor. These equipments can be managed with close monitoring as well frequent maintenance till a point, were it is more economical to replace the machine. For newer machines, the causes could be traced to fine-tuning of setting as well operator errors.
Startup rejects are easier to track as this happens between startup and steady operation. Following steps will help reducing the start up rejects:
Multiple publically available information sources on OEE were referred. I would like to specifically acknowledge one of the greatest source of information on OEE such as www.oee.com.